Statistics
Making sense of abnormal data science
Transforming spatial statistics to capture the skewness and tail of the statistical distribution gives a clearer picture of weather and climate data.


In environmental and climate science, it is common to accumulate enormous data sets consisting of measurements of wind speed, temperature, rainfall and other variables across space and time. It is then the job of statisticians to develop the analytical tools to make sense of the loads of data in a way that extracts the most accurate and yet simplest representation of these spatiotemporal data sets.
Yuan Yan and Marc Genton from KAUST’s Statistics Program, in collaboration with Jaehong Jeong, from the University of Maine, have now added to their group’s repertoire of statistical data science tools with the development of a flexible transformation framework for non-Gaussian data.
“Gaussian or ‘normally distributed’ data follows the classic bell curve shape,” explains Yan. “It is a symmetric probability distribution, with most values centered around the average or mean, and ‘tails’ of less frequent values extending equally both higher and lower. However, not all data sets behave this way. Wind speeds, for example, can’t be less than zero and tend to cluster at low to medium values with a long tail to much higher speeds that occur less frequently. This type of probability distribution is known as ‘non-Gaussian’.”
The descriptive functions for non-Gaussian distributions are well-known and are typically captured by three parameters: the mean (average), skewness (asymmetry) and kurtosis (tail length). However, running non-Gaussian analyses on large, multivariable datasets is highly computationally intensive, and there is no guarantee that the selected parameterization accurately describes the data across the entire spatial realm.
“In this study we transform the underlying Gaussian functions into more accurate non-Gaussian functions by applying a transform function using parameters that control the shape of the distribution,” says Yan.
Importantly, the team’s framework allows the parameterization of the transform function to be defined at all points across the spatial extent of the data set in a way that best describes the data at each point. The resultant distribution of skewness and kurtosis (see image) can tell researchers much about the data.
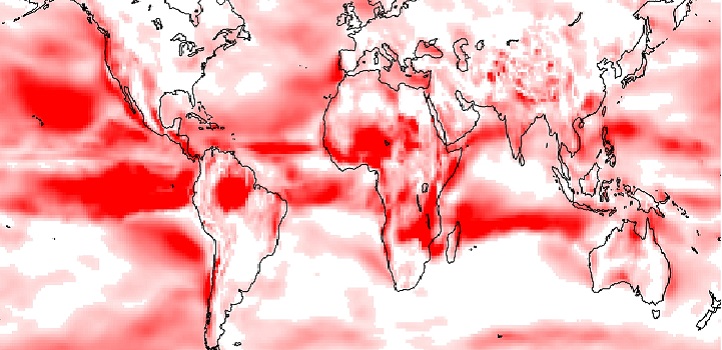
The kurtosis variation of non-Gaussian wind speed distribution, showing regions with more frequent extreme values (red).
© 2019 Yuan Yan
“We can see from these types of plots, in this case for wind speed, which tail of the distribution is longer in different locations and regions in which extreme values occur more or less frequently,” says Yan.
“Our framework is quite general,” explains Yan. “It could be applied to any data collected in space and/or time, such as surface pressure and temperature data in climate science, the concentrations of different pollutants in environmental science, or even the catch weights of different species in fisheries science.”
References
- Yan, Y., Jeong, J. & Genton, M.G. Multivariate transformed Gaussian processes. Japanese Journal of Statistics and Data Science 3, 129–152 (2020).| article
ABOUT THE AUTHOR
Yuan Yan
Alum

You might also like

Statistics
Checking your assumptions

Statistics
Internet searches offer early warnings of disease outbreaks

Statistics
Joining the dots for better health surveillance

Statistics
Easing the generation and storage of climate data

Statistics
A high-resolution boost for global climate modeling

Applied Mathematics and Computational Sciences
Finer forecasting to improve public health planning

Bioengineering
Shuffling the deck for privacy

Bioengineering