Statistics
Epilepsy study shows the shape of things to come
Pyramidal graphs resulting from statistical analyses of EEG recordings can improve our understanding of epileptic seizures.


A statistical approach squeezes more detailed information out of a current method of measuring brain signals in epileptic seizures, adding new insight into how these signals originate and spread.
Visual inspection of electroencephalography (EEG) recordings of epilepsy patients before and during a seizure is a fairly effective method for detecting the part of the brain that can benefit from surgical treatment. But it’s not sufficient for more challenging cases.
Now, an approach developed by KAUST biostatistician Hernando Ombao and colleagues Yuan Wang of the University of Wisconsin–Madison and Moo K. Chung of the University of California, Irvine, digs deeper into the features of an EEG and can detect abnormalities in brain regions even before a seizure takes place.
The method could provide a clinically useful tool for seizure localization, according to Chung and Wang.
The approach stems from a field of mathematics that analyzes large and complex datasets by studying shape representations of the data and its interactions. Analyzing these shapes provides information on patterns that exist within the data. The team applied their method, known as a topological data analysis framework, to see what they could learn from an EEG recording conducted before and during an epileptic seizure.
The statistical approach removes noise from the EEG recording, providing cleaner signals. A series of shapes are then drawn that directly relate to the signals in the recordings. The final pyramidal shapes (persistence landscapes) that represent the signals coming from each electrode placed on the scalp provide a good picture of where the seizure originates in the brain and how it spreads.
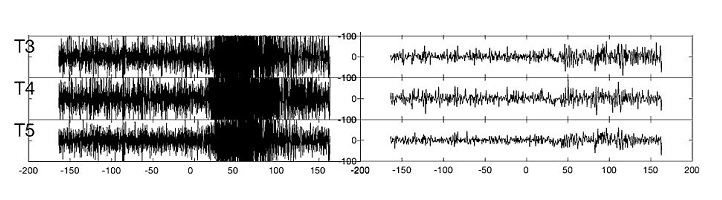
The original EEG at the start of a seizure (left) compared to the signal when cleaned from noise (right).
Reproduced with permission from reference one © 2018 Institute of Mathematical Statistics.
The analysis of the patient’s EEG recording showed that the seizure originated from a region in or around the electrodes measuring signals from the left temporal lobe of the brain. It then spread to the right temporal lobe.
Further simulation studies showed that the test was robust and sensitive, even when the signal was buried under noise.
The landscape before and during seizure EEG signals once the noise has been removed. Reproduced with permission from reference one © 2018 Institute of Mathematical Statistics.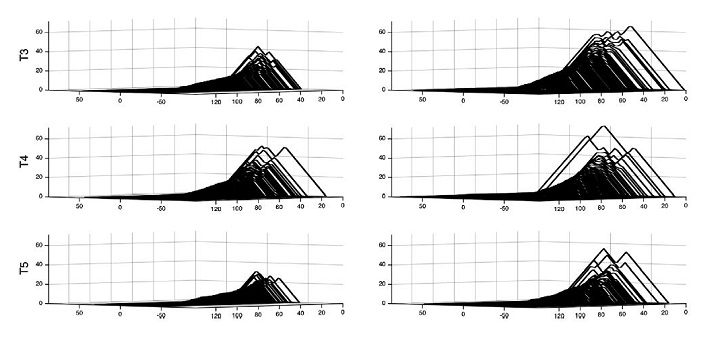
“Epileptologists should enhance their toolboxes of data analysis by adding methods like this one that capture topological features as part of their assessment of seizure foci in more challenging cases of epilepsy,” says Ombao.
The team next plans to test their framework on large samples of EEG recordings to clinically validate their findings. Ombao is also developing statistical methods to study the impact of shocks to the brain, such as in epilepsy or stroke, on the communication network between brain regions and nerve cell populations.
References
- Wang, Y., Ombao, H. & Chung, M. K. Topological data analysis of single-trial electroencephalographic signals. The Annals of Applied Statistics 12, 1506–1534 (2018).| article
ABOUT THE AUTHOR
Hernando Ombao
Professor

You might also like

Statistics
Checking your assumptions

Statistics
Internet searches offer early warnings of disease outbreaks

Statistics
Joining the dots for better health surveillance

Statistics
Easing the generation and storage of climate data

Statistics
A high-resolution boost for global climate modeling

Applied Mathematics and Computational Sciences
Finer forecasting to improve public health planning

Bioengineering
Shuffling the deck for privacy

Bioengineering