Statistics
New stats apps show a virtual reality
Harnessing the power of virtual reality will help to visualize data and improve statistical models.


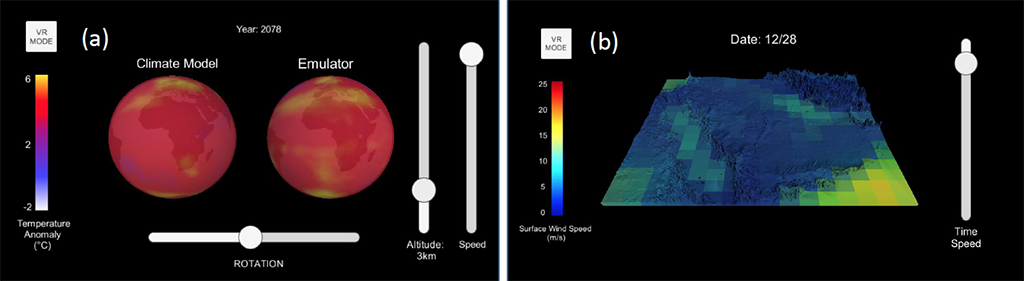
A snapshot of two apps developed to visualize and compare climate model output and output from a statistical model (emulator). The statistical emulator app reproduces annual three-dimensional temperature from 1850 to 2100 (a) and reproduces daily winds over the Arabian peninsula from 1920 to 2100 (b).
© 2018 KAUST
The latest advances in computing and virtual reality (VR) have enabled researchers at KAUST to develop a suite of apps that allow users to visualize and interpret large and complex datasets in three dimensions.
Statistical modeling has traditionally relied on high-resolution maps of large and complex spatio-temporal datasets, which contain data that vary by location and time. This type of modeling helps scientists to understand relationships within the data and how they vary over time; it also helps them to quantify uncertainties.
Advances in computing power and the advent of fully immersive VR, however, offer new and more powerful tools for analyzing data, allowing statisticians to visualize, explore and assess data, leading to more accurate models.
“New statistical applications for modeling data in space and time, especially in the context of global data, are focusing on how we can represent a model that looks like the original data,” explains Marc Genton from KAUST. “This has led us to investigate the role of visualization, particularly VR, to generate maps visually similar to the original data.”
Pioneers in the use of VR and immersive technologies for visualizing real-world datasets, KAUST faculty Genton and Ying Sun, in collaboration with Stefano Castruccio from the University of Notre Dame in the United States, worked with the KAUST Visualization Core Laboratory, a state-of-the-art facility that offers a fully immersive VR environment to realize their app. The team used global temperature data from 2006 to 2100 to compare a climate model with a simulation from a statistical model, called an emulator. By using a VR headset with wireless motion capture technology, users could interactively explore features of the data, allowing them to compare how visually similar the climate model was to the emulator.
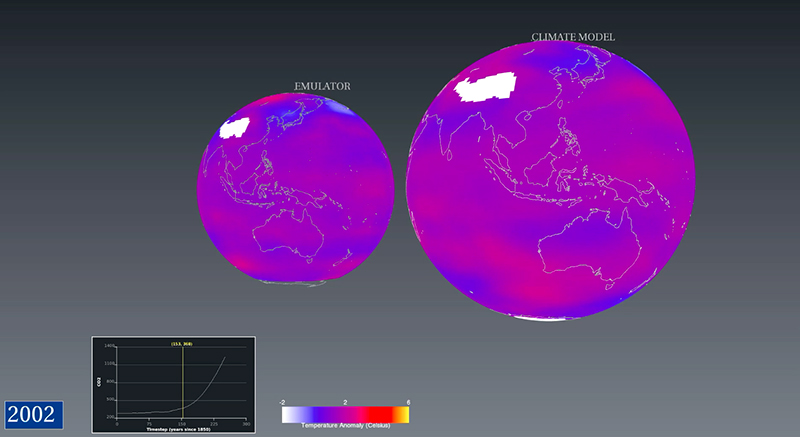
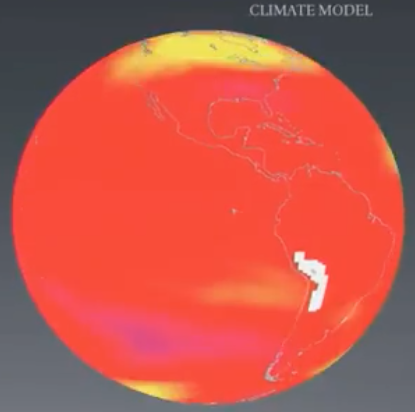
A comparison of global temperature anomaly from a climate model (right) with the statistical simulation from an emulator (left).
© 2018 KAUST
“The ability to visually explore data in a three-dimensional, immersive environment will offer a more powerful tool for interpreting data than two-dimensional, planar mapping,” says Sun.
The work has led to the creation of several apps that allow scientists from the wider community to share the immersive experience provided at the Visualization Core Laboratory.
“Many fields of science will benefit from our work,” says Castruccio. “The significance of this work has been recognized at the Royal Statistical Society’s annual meeting in Cardiff, where Castruccio presented this work in September 2018 as a read paper—the highest honor in the statistics community.
References
-
Castruccio, S., Genton, M.G. & Sun, Y. Visualising spatio-temporal models with virtual reality: From fully immersive environments to apps in stereoscopic view. Journal of the Royal Statistical Society Series A 182, 1-9 (2018).| article
ABOUT THE AUTHOR
KAUST Core Labs
The Visualization Core Lab

You might also like

Statistics
Checking your assumptions

Statistics
Internet searches offer early warnings of disease outbreaks

Statistics
Joining the dots for better health surveillance

Statistics
Easing the generation and storage of climate data
Statistics
A high-resolution boost for global climate modeling

Applied Mathematics and Computational Sciences
Finer forecasting to improve public health planning

Bioengineering
Shuffling the deck for privacy

Bioengineering