Statistics
Taking aim at outliers
Automatic detection of uncharacteristic data sequences could change the way data is processed and analyzed.


By deriving a measure of the characteristic way that a data series varies over time, KAUST statisticians have found a powerful solution to the problem of detecting outliers in monitoring data.
An important first step in statistical processing is to remove potentially abnormal values in the data. A faulty temperature sensor, for example, could be generating data that might significantly alter the average temperature and range calculated for a meteorological station, or trigger a shutdown in a manufacturing process. Usually, the detection of such outliers is based on some threshold or rule, and it is comparatively easy for a computer to use this rule to highlight erroneous data.
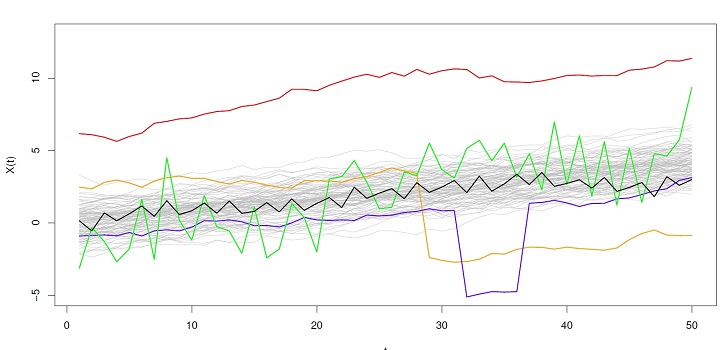
But what if the data is within the normal range but behaving erratically? What if the temperature reading suddenly drops by just a few degrees due to a sensor fault, or fluctuates incorrectly? These types of “shape” outliers are easy enough for a human to spot, but tremendously difficult to detect using an automatic algorithm.
Huang Huang and Ying Sun encountered this problem through their research on ways to clean, analyze and present complex environmental data.
“There is no universal definition of shape outliers because too many types of shape outliers exist. This makes them more difficult to detect,” explains Huang.
Shape outliers can be regarded as data originating from any source process that leads to a different pattern, such as a different frequency of oscillation or a sudden jump. Building on previous work, Huang and Sun developed a metric for characterizing shape in a data series statistically, and used it as a basis for shape-outlier detection.
“We decompose the variation in the data into two components corresponding to magnitude and shape,” says Huang. “The challenge, however, was how to detect shape outliers as accurately as possible because there are many different types of outliers. In our study, we tried out a wide range of outlier models and were able to achieve good outlier detection while accounting for the natural correlation in the data.”
One direct benefit of this work is through preprocessing real-world datasets to remove erroneous observations and thus improve the accuracy of statistical analyses. However, as Huang points out, the approach could also be used to pick out unusual sequences for further investigation.
“Sometimes, the outliers themselves can be more interesting than the regular observations,” Huang says.
The researchers note that sometimes the outliers themselves are more interesting than the regular observations.
Reproduced with permission from reference 1 © 2019 Taylor & Francis
References
- Huang, H. & Sun, Y. A decomposition of total variation depth for understanding functional outliers. Technometrics early online version 11 February 2019.| article
ABOUT THE AUTHOR
Huang Huang
Alum

You might also like

Statistics
Checking your assumptions

Statistics
Internet searches offer early warnings of disease outbreaks

Statistics
Joining the dots for better health surveillance

Statistics
Easing the generation and storage of climate data

Statistics
A high-resolution boost for global climate modeling

Applied Mathematics and Computational Sciences
Finer forecasting to improve public health planning

Bioengineering
Shuffling the deck for privacy

Bioengineering