Statistics
Making collective sense of brainwaves
A new statistical tool for collectively analyzing large sets of brainwaves promises to accelerate neurofunctional research.

The lack of tools to be able to pinpoint anomalies in large datasets that vary through time sparked a search by KAUST scientists for new efficiencies to help brain research.
Searching for correlations and similarities in large datasets of time-varying information, such as brain signals, is a formidable task. One technique researchers use to test for such correlation is to analyze the signal’s frequency composition: the mix of slow and fast oscillations contained in the waveform. However, these spectral-density analyses contain a lot of low-level background noise, and so it can be difficult to identify genuine correlations from the raw spectral-density function (SDF).
A smoothing process can be applied to reduce noise in the SDF, but the degree of smoothing needs to be optimized to avoid losing the valuable detail in the data needed to pick out real correlations. Normally, this needs to be done for each signal trace before it is compared with others. For an electroencephalogram (EEG) involving tens or hundreds of simultaneous brain signal recordings, this quickly becomes an enormous and inefficient task.
Motivated by the lack of statistical tools for dealing with such problems, KAUST researcher Ying Sun and her doctoral student Tainbo Chen, in collaboration with Mehdi Maadooliat from Marquette University in the United States, developed an efficient method for collectively estimating the SDFs for large numbers of recorded traces.
“Most existing methods either estimate the spectral density separately or suffer from computational issues,” says Chen. “Collective estimation is statistically more efficient,” he explains, “and by applying a clustering technique to reduce the dimensionality of the data, we could develop a computationally efficient method that outperforms commonly used methods and can also visualize the similarity among time series.”
The key challenge in developing this approach was coming up with a way to ensure that the SDFs estimated from the times series were smooth. “Because we only had the observed time-series data to work with, we had to develop a new criterion for estimating the spectral density,” says Chen. “We used a measure of how consistent the statistical model is to the data combined with a measure of the smoothness of the estimated function.”
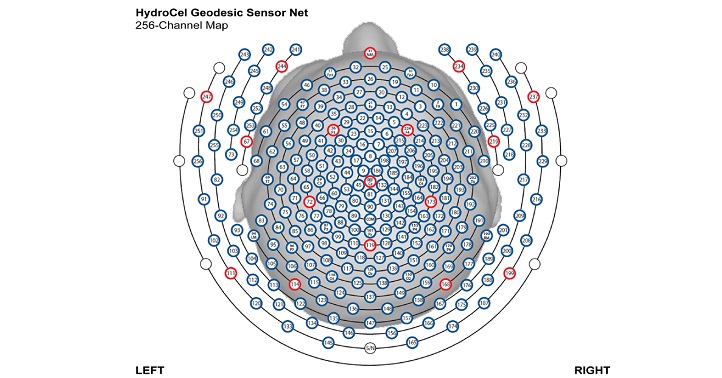
The team tested their collective SDF estimation method by using it to detect correlations among brain regions using EEG recordings from 194 electrodes placed on a subject’s scalp.
“By clustering the brain signals from different brain locations, we were able to identify brain regions where the EEG signals share similar waveforms,” says Chen.
The team has also developed an interactive app that allows anyone to upload their own data and conduct a similar analysis with visualizations.
References
-
Maadooliat, M., Sun, Y. & Chen, T. Nonparametric collective spectral density estimation with an application to clustering the brain signals. Statistics in Medicine 37, 4789-4806 (2018).| article
You might also like

Statistics
Checking your assumptions

Statistics
Internet searches offer early warnings of disease outbreaks

Statistics
Joining the dots for better health surveillance

Statistics
Easing the generation and storage of climate data

Statistics
A high-resolution boost for global climate modeling

Applied Mathematics and Computational Sciences
Finer forecasting to improve public health planning

Bioengineering
Shuffling the deck for privacy

Bioengineering


