Statistics
Solving real-world problems
A tool developed by Håvard Rue has transformed data analysis, interpretation and communication. It has been applied broadly: from modeling the spread of infectious diseases to mapping fish stocks.

Statistics is the science of learning from data, with statisticians providing valuable insights into the most pressing problems facing humanity, such as the health impacts of pollution to the spread of infectious diseases.
Researchers need to understand statistics if they are to make informed decisions.
“Providing the tools for scientists to better understand real-world problems means policymakers have access to reliable data for making important decisions that affect many aspects of life, from health and the environment to the economy and social issues,” explains KAUST Professor of Statistics Håvard Rue.
Rue is a pioneer in the field of computational Bayesian statistics, a method that applies probabilities to statistical problems, leading to faster and more accurate predictions. His work focuses on the application of integrated nested Laplace approximations (INLA), an approach for undertaking Bayesian inference that updates conclusions that are drawn from statistical models in the light of new data.
“The main issues with Bayesian modeling are speed and accuracy,” explains Rue. “Normally you have to trade speed for accuracy, but with INLA you get both. It’s almost too good to be true.”
The INLA approach represents a different way of analyzing high-dimensional datasets containing thousands of measurements—such as those used for modeling climate or predicting weather models—and are too complex for methods like Markov chain Monte Carlo sampling, which are time-consuming and impractical for very large models.
To help apply the INLA statistical method and to better analyze increasingly large datasets, Rue and his colleagues developed the R-INLA statistical software package, which enables INLA application in diverse fields, from healthcare to ecology.
For example, Gavin Shaddick, professor of Data Science and Statistics at the University of Exeter in the United Kingdom, used R-INLA to analyze a database containing data from more than 4,300 cities in 100-plus countries to model the health and environmental impacts from air pollution.
A statistical application developed by Prof. Håvard Rue has transformed data analysis, interpretation and communication.
© 2018 KAUST
“Air pollution is a major risk factor for global health with 4.2 million deaths annually attributed to fine particulate matter pollution,” says Shaddick. “Without R-INLA we would not have been able to perform these analyses on a global scale.”
The work, in collaboration with the World Health Organization (WHO), has shown that 92 percent of the world’s population resides in areas exceeding the WHO’s air quality guidelines.
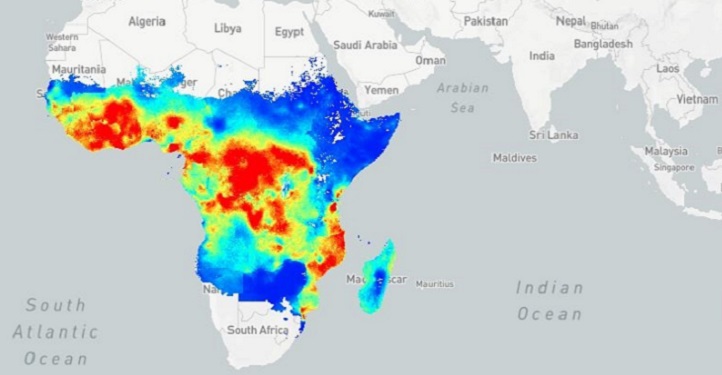
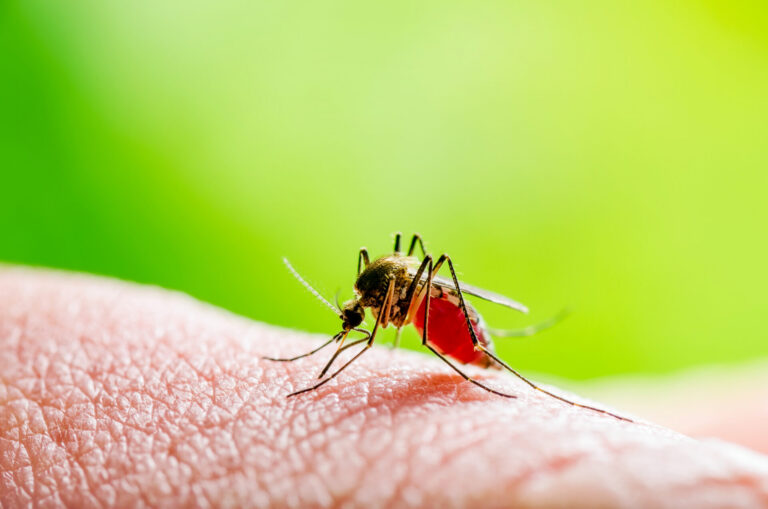
The method has also been used by the Malaria Atlas Project (MAP), which disseminates free, accurate, up-to-date information on malaria, and aims to limit the spread of the disease. According to the WHO’s World Malaria Report 2017, an estimated 216 million cases of malaria occurred globally in 2016, an increase of around 5 million cases from the previous year.
“Before R-INLA if was not possible to perform inference for more than a thousand observations, making this an important tool in understanding the spread of malaria,” says, Samir Bhatt from Imperial College Public School of Health in London, U.K., who used the R-INLA to model the prevalence of different forms of malaria on a global scale.
The Center for Disease Control and Prevention (CDC) is also using R-INLA to map the rising numbers of suicides across the United States, providing an unprecedented level of detail by allowing changes in suicide rates in over 3,000 counties to be tracked from 2005 to 2015.
“Understanding the geographic patterns of suicide rates helps us to determine which counties report high rates and are in need of suicide prevention resources,” explains Diba Khan, senior service fellow at the CDC. “By using INLA, local public health agencies are able to allocate funds to achieve health outcomes not possible from only state-level data.”
The INLA method has also been applied by researchers at the Catholic University of Valparaíso to map the distribution patterns of shrimp off the coast of Chile. It has allowed them to identify areas where fishing is possible and to make recommendations on catch quotas to help manage fish resources.
“I’m still surprised when I see applications of INLA in areas I have never heard of and are outside core statistics. This demonstrates that what we are doing is important and has an impact on how people work with statistics,” says Rue.
References
- Rue, H., Riebler, A., Sørbye, S.H., Illina, J.B. & Simpson, D.P. Bayesian computing with INLA: A Review. Annual Review Statistics Applications 4, 395-421, 2017.| article
-
Bakka, H., Rue, H., Fuglstad, G-A., Riebler, A., Bolin, D. et al. Spatial modeling with R-INLA: A review. WIREs Computational Statistics 10, 2018.| article
You might also like

Statistics
Checking your assumptions

Statistics
Internet searches offer early warnings of disease outbreaks

Statistics
Joining the dots for better health surveillance

Statistics
Easing the generation and storage of climate data

Statistics
A high-resolution boost for global climate modeling

Applied Mathematics and Computational Sciences
Finer forecasting to improve public health planning

Bioengineering
Shuffling the deck for privacy

Bioengineering


