Statistics
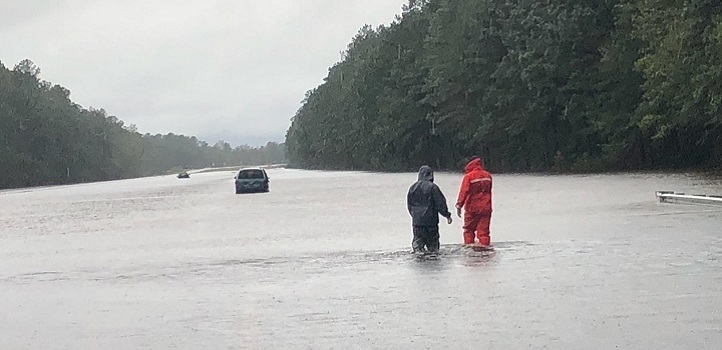
Expanding the scale of dangerous weather prediction
A more accurate and efficient method of capturing the local factors that lead to extreme rainfall enables better flood prediction across larger regions.


A statistical model that better characterizes the changing nature of extreme weather over larger areas could help climate experts plan for weather-related disasters.
An increase in the severity of extreme weather events around the world, such as droughts and floods, is creating a need for information that will help us better plan for these extreme events. Although vast volumes of weather data are recorded every day across the globe, extracting crucial information on extreme events puts huge demands on computing power and is limited to analysis across only a few locations.
Raphael Huser and his former postdoc Daniela Castro-Camilo have now developed a more computationally efficient statistical model to address these constraints.
“One of the main challenges in extreme weather statistics is to describe the relationship between extreme observations, such as rainfall changes across multiple locations,” explains Castro-Camilo. “Current models and methods can deal with only a limited number of locations at once and are not flexible enough to capture all the different dynamics we see in precipitation data.”
To accurately predict the frequency and magnitude of an extreme weather event across an area, Castro-Camilo and Huser focused on the dependence structure, which describes how strongly, and in what way, the data at several locations are related to one another.
“As events become more extreme, they also tend to become less dependent,” says Castro-Camilo. “This behavior is well recognized in climatological data, but classical extreme-value models are not able to describe this characteristic. Our model can do this.”
Castro-Camilo and Huser’s model allows the dependence structure to be estimated from each measurement station and then efficiently interpolated between stations over a fine spatial grid using a highly parallelized computational approach.
“The main challenges in this study were in fact computational,” says Castro-Camilo. “Fortunately, we had access to KAUST’s Shaheen II supercomputer, which allowed us to obtain results in a few days rather than the months we might have had to wait if using a standard computer.”
Using their new approach, the researchers analyzed for extreme events in precipitation data across the entire contiguous United States—a total of 1218 weather stations and an unprecedented scale for such an analysis. They found that the dynamics that govern extreme precipitation events differ strongly across regions, and they quite clearly identified specific areas where simultaneous dangerous levels of precipitation are more frequent.
“Our approach can also be used with other types of climatological data as it has been developed specifically to deal with high-dimensional problems involving many measurement stations,” says Castro-Camilo.
References
- Castro-Camilo, D. & Huser, R. Local likelihood estimation of complex tail dependence structures, applied to U.S. precipitation extremes. Journal of the American Statistical Association, early online version, 5 September (2019).| article
ABOUT THE AUTHOR
Daniela Castro
Alumna

You might also like

Statistics
Checking your assumptions

Statistics
Internet searches offer early warnings of disease outbreaks

Statistics
Joining the dots for better health surveillance

Statistics
Easing the generation and storage of climate data

Statistics
A high-resolution boost for global climate modeling

Applied Mathematics and Computational Sciences
Finer forecasting to improve public health planning

Bioengineering
Shuffling the deck for privacy

Bioengineering