Statistics
Improving connections for spatial analysis
A statistical model that accounts for common dependencies in spatial data yields more realistic results for studies of temperature, wind and pollution levels.


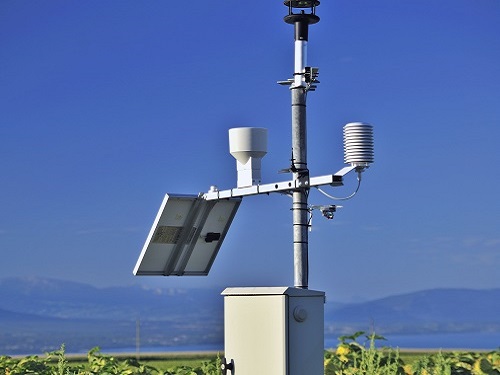
The researchers demonstrated the usefulness of their factor copula model by applying it to the analysis of daily mean temperatures across Switzerland.
© Alistair Scott. Alamy stock image B83CD3
A statistical model for spatial data, such as temperatures at different locations, that more accurately represents the geographical relatedness among measured variables has been developed by KAUST researchers.
Robust and realistic statistical models are critical to almost all fields of scientific research and engineering. Choosing the wrong statistical model for a given data set can lead to a potentially catastrophic misinterpretation of results, while a model that accounts for the mechanistic relationship between variables can lead to new insights and discoveries.
“Spatial statistics involves modeling variables measured at different spatial locations,” said Marc Genton, Professor of Applied Mathematics and Computational Science at KAUST. “Many existing models, called copulas, cannot properly capture the spatial dependence among variables, such as when the dependence between variables becomes weaker with increasing distance—as is the case with temperature.”
Genton, with his colleagues Pavel Krupskii and Raphaël Huser, designed a copula that can handle different types of dependencies among variables1. Their model also offers simpler interpretation of the data compared with other models: this interpretation, put simply, says there exists an unobserved common factor that affects all the variables simultaneously.
“For example, temperature data in a small geographical region may be subject to common weather conditions, which can be thought of as a common factor,” explained Genton. “To represent such situations, we have used a standard Gaussian model and added a common random factor that affects all the variables simultaneously, which is a plausible assumption in many spatial applications.”
A Gaussian model is one of the most fundamental and versatile of statistical models. It is used to describe a random distribution of values about an average value similar to the classic bell curve in which most measured values occur near the average with two tails on either side. These tails represent the increasing rarity of significantly higher or lower values from the average. The Gaussian model is particularly powerful in Genton’s factor-based copula because it allows for natural integration of a common-factor dependence among variables.
The researchers demonstrated the usefulness of their factor copula model by applying it to the analysis of daily mean temperatures across Switzerland. Their model performed well compared with other statistical approaches and gave a more robust representation of the underlying dependence between geographical locations.
Looking forward, Genton explained, “Our copula can be used to model any variable measured repeatedly in time at different spatial locations, such as daily or hourly temperature or wind data at different weather stations, or to model pollution levels measured using weather balloons or satellites.”
References
-
Krupskii, P., Huser, R. & Genton, M.G. Factor copula models for replicated spatial data. Journal of the American Statistical Association 113, 467-479.| article
You might also like

Statistics
Checking your assumptions

Statistics
Internet searches offer early warnings of disease outbreaks

Statistics
Joining the dots for better health surveillance

Statistics
Easing the generation and storage of climate data

Statistics
A high-resolution boost for global climate modeling

Applied Mathematics and Computational Sciences
Finer forecasting to improve public health planning

Bioengineering
Shuffling the deck for privacy

Bioengineering


