To better defend online data, a laser-based system to generate digital ‘keys’ can offer greater security than conventional approaches. The system, developed by KAUST, uses very little energy to produce a stream of complex keys, which act as unique fingerprints to safeguard data[1].
“A key is a piece of information used to prove identity, protect data, or authorize access,” explains Yating Wan of the Integrated Photonic Laboratory at KAUST, who co-led the research team. “If the correct key is presented, the system accepts the user or device; if not, access is denied.”
Conventional digital security systems often rely on stored keys, passwords, or mathematically generated codes. These can be vulnerable if the stored information is copied, leaked, or reused.
To overcome that threat, some security systems produce a long series of different keys, each generated on demand and used only once. But generating truly random keys can be relatively slow, and often demands huge computing power.
Physical unclonable functions (PUFs) offer a potential solution. These systems exploit small physical differences in hardware to generate a unique key every time one is needed. “These differences naturally arise during fabrication and are extremely difficult to reproduce exactly,” explains Zhican Zhou, a Ph.D. student in Wan’s team. “A PUF adds a hardware-rooted layer of security because the secret is not simply stored in memory; it is dynamically generated from the physical behavior of the device itself.”
In collaboration with Boon Ooi’s group at KAUST, Wan’s team proposed using chaotic vertical-cavity surface-emitting lasers (VCSELs) as PUFs for dynamic authentication. These VCSELs are devices barely 200 micrometers wide, which can be fabricated on chips using commercial mass-production processes.
Each VCSEL produces a chaotic laser output with a varying intensity that is difficult to predict or reproduce, but which has unique statistical features. Varying the device’s drive current and operating temperature can produce further distinctive statistical features. By combining different devices with different operating states gives the PUF system a large set of distinct key-generating configurations. Each configuration’s chaotic response stream can be segmented into many dynamic keys that share the same configuration-specific statistical features.
The researchers then trained an AI model to recognize these features, so that it could check whether a key originated from one of the registered key-generating configurations, or whether it was a fake. They also developed an AI-assisted system to encode the key into a compact, hidden form for secure transmission.
To demonstrate their system, the researchers built an array of more than 100 VCSELs. Each device generates over 500 gigabits of data per second, enough to create a new key every 10 nanoseconds. A key contains more than 5,000 bits of entropy, roughly 20 times as much as today’s standard encryption keys.
The VCSELs have a very low energy consumption, requiring less than 1 picojoule (10-12 J) per bit. Consequently, the system could generate trillions of keys using less energy than it takes to boil a cup of water.
The researchers now plan to build a prototype system that combines all of these elements into a compact security chip suitable for practical use.
Cancer patients could gain accelerated access to potentially life-saving treatments, following the development of a high-tech, low-cost nanophotonic platform that aims to streamline patient tissue sample analysis.
In suspected cases of cancer and other diseases, diagnosis is confirmed by highly trained pathologists analyzing patient tissue samples under the microscope. To enhance the color contrast between different cell structures and tissue types, chemical dyes are added, making the telltale signs of cancer and other health conditions easier to spot.
Staining tissue samples for disease diagnosis requires specialist skill. However, it is costly, time-consuming, and prone to inconsistencies. KAUST’s Qiaoqiang Gan and his collaborators therefore set out to develop an alternative approach.
“Our goal was to develop a stain-free optical microscopy platform that could still provide pathologically meaningful cellular and tissue-level information,” says Qizhe Chen, a student in Gan’s lab.
Rather than relying on chemical dyes, Gan and his team focused on “structural color” to enhance the cellular features that pathologists use to diagnose disease[1]. Structural color arises in materials with nanoscale surface structures so fine that they interact with light, absorbing some wavelengths while reflecting others to create color.
Butterfly wings and peacock feathers are natural materials with brilliant structural color. It can also be designed into synthetic materials with nanostructured surfaces, says Gan, who has studied nanophotonics and structural color for nearly two decades.
“Since joining KAUST, I have been interested in applying these principles to real-world problems,” Gan says. “Through discussions with our clinical collaborators at Huashan Hospital in Shanghai, we realized that structural color could potentially provide a new contrast mechanism for tissue imaging without relying on traditional chemical staining.”
The team designed structurally colored microscope slides made from silicon wafers nanocoated with silicon nitride. “The silicon nitride nanolayer acts as an ‘optical nanocavity’,” Chen says. When light reflects off the slide, the nanocoating selectively enhances certain wavelengths while suppressing others. The team harnessed this tuned reflectivity to amplify optical differences between cancerous and healthy tissue. “The slides display these differences as distinct colors, making cancer-associated regions easier to distinguish from healthy tissue,” Chen says.
The team used real tissue samples from colorectal cancer patients to demonstrate the diagnostic potential of their nanocavities-on-silicon (NOS) slides, says Yanyan Li, a postdoc in KAUST’s Bioscience program who collaborated with Gan’s team. “The slides provided sufficient color contrast to visualize differences between normal and cancerous colorectal tissue regions without conventional staining,” she says. An additional advantage is that, by preserving the tissue sample in an unstained state, pathologists could run additional cancer assays on the same slide, further streamlining the diagnostic workflow, Li notes.
NOS slides are simple and inexpensive to make, which is crucial for high-throughput biomedical use. The team was able to record thousands of NOS slide microscope images of healthy and cancerous tissue – capturing enough image data to train an AI model to automatically detect colorectal cancer in NOS microscope images.
“The model showed strong performance in distinguishing healthy from cancerous colorectal tissue, achieving greater than 95 percent accuracy,” says Lijie Hu, a student in the Computer Science program who collaborated on the project.
Gan and his team are now exploring whether nanophotonic technology could reveal additional information in tissue samples, for advanced disease diagnostics beyond conventional staining. They are also building large, high-quality NOS imaging datasets for AI-assisted diagnosis, Gan adds.
“We are working with colleagues at KAUST, and at local hospitals, to implement and validate this technology in clinically relevant settings,” Gan says. “Our long-term goal is to combine nanophotonic stain-free imaging with AI to address important healthcare challenges in Saudi Arabia and beyond, making pathology faster, more scalable, and potentially more accessible.”
Gene editing has reshaped biology and produced its first approved medicine, yet CRISPR, the widely used gene-editing technology, faces two stubborn obstacles on its march into the clinic: the leading editors are too big to deliver with standard viral vectors, and they can cut DNA in the wrong place, raising fears about unintended genetic changes.
Two new studies from researchers in KAUST describe a new generation of genome editors designed to tackle both challenges at once. These editors are small enough to fit inside a single viral delivery vehicle, while also engineered to edit DNA with greater precision.
Currently, all approved CRISPR therapies require cells to be removed from patients, edited outside the body, and reinfused after intensive chemotherapy. This complex procedure can cost millions of dollars, carry substantial treatment-related risks and work only for conditions such as sickle-cell disease and beta-thalassemia that originate in blood-forming stem cells.
If the KAUST discoveries can be translated from laboratory experiments into clinical therapies, it may eventually become possible to deliver gene-editing treatments directly into the body using a single virus carrying a compact, highly specific editor. The authors of the studies, in collaboration with clinical and translational partners, are actively pursuing therapeutic applications of these new CRISPR technologies, with a focus on rare genetic disorders.
“Together, these results move the field one concrete step closer to a CRISPR therapeutic platform that is small enough to deliver, specific enough to trust, and effective enough to use,” says Magdy Mahfouz, head of the Laboratory for Genome Engineering and Synthetic Biology, who led the research.
One of the new studies, published in Trends in Biotechnology, focused on the problem of size. Mahfouz and his colleagues computationally combed through millions of viral genomes in search of sequences encoding Cas12j, a naturally tiny type of CRISPR enzyme originally discovered in bacteria-infecting viruses. In this way, they identified eight previously unknown Cas12j variants, expanding the known diversity of this promising family of miniature gene editors[1].
In their natural form, these enzymes proved only weakly adept at editing human cells, but targeted engineering changed that. By fusing the Cas12j variants to a second enzyme that helps cells process broken DNA ends, the researchers transformed the new suite of CRISPR proteins into robust genome-editing tools. In laboratory tests, the engineered editors performed on par with Cas12a, one of the field’s workhorse CRISPR systems, despite being substantially smaller.
Along the way, the team uncovered an unexpected design rule of Cas12j editors: they work most efficiently when their DNA targets contain a specific three-letter sequence, TAC. “This is a previously unrecognized design principle that now guides how the entire Cas12j family should be deployed,” says Wenjun Jiang, a Ph.D. student in Mahfouz’s group, and the co-first author of the study.
The second study, published in Nucleic Acids Research, addressed the other major obstacle facing CRISPR therapeutics: specificity. The KAUST team began with a compact CRISPR protein called GoCas12m that binds DNA but does not cut it. They fused on to it a DNA-cleaving enzyme called FokI nuclease[2]. Because FokI can cut DNA only when two copies of the enzyme come together, two complete GoCas12m-FokI complexes must bind adjacent genomic sites before editing occurs.
As a result, the system behaves like a molecular two-factor authentication scheme: “It only cuts DNA when two molecules find their target side by side, making accidental edits at the wrong location far less likely,” explains Tin Marsic, former Ph.D. student in Mahfouz’s group, who describes the GoCas12m-FokI editor that he helped build as “cautious by design.”
The researchers demonstrated highly specific genome editing at several clinically relevant targets, including the AIFM1 gene linked to mitochondrial disorders and the ABL gene implicated in leukemia, with no detectable off-target activity at the genomic sites examined.
The new editors remain at an early stage of development and have not yet been tested in mice, let alone people. However, they provide a foundation for what Mahfouz and his colleagues hope will become a new generation of precision genetic medicines that, owing to their small size, could one day be delivered directly into patients with a simple injection.
The implications also extend beyond human health. “The same GoCas12m–FokI architecture could, in principle, be adapted to edit crop genomes, to improve microbial production strains or to target pathogens, with similar gains in precision and deliverability,” says Sivakrishna Gundra, a postdoc who made major contributions to both studies.
For Mahfouz’s team, the goal is not merely to build better molecular scissors, but to create editors small and reliable enough to function as versatile tools across medicine, agriculture and industry.
Master stonemasons use temporary timber formwork to help them build grand stone window frames, domes, and archways. Master molecule makers have now adapted this technique to the nanoscale, creating crystalline materials with airy molecular architectures featuring vast internal spaces and wide, open windows.
Like the best buildings, the resulting materials combine elegant architecture with practical function. With their record-breaking internal volume, these porous materials could find applications for storing target gases such as carbon dioxide and methane.
Mohamed Eddaoudi and his team at KAUST, including research scientist Vincent Guillerm, are pioneers in ‘reticular chemistry’. They design molecular building blocks that link to form open three-dimensional structures such as metal-organic frameworks (MOFs), which consist of metal atoms connected by organic linkers.
The team recently developed a way to make MOFs of exceptional structural complexity, by using molecular scaffolds called centring structure directing agents (cSDA) that template the MOFs’ assembly into the desired structure[1].
“These cSDAs enabled us to make novel architectures, or topologies, that were unattainable through conventional synthetic approaches,” Guillerm says.
In the team’s first examples, the cSDAs were a permanent feature of the MOF structure. If the cSDAs could be removed, however, it would free up volume and improve the flow of gas molecules in and out of the structure. “The key motivation for our latest work was to transform cSDAs from permanent structure-directing ligands into temporary molecular scaffolds,” says Aleksandr Sapianik, a postdoc in Eddaoudi’s lab.
Finding a way to selectively remove the cSDAs without damaging the rest of the structure was the key challenge[2], Guillerm says. “We developed two complementary routes based on the intrinsic stability of the parent MOFs,” he adds. Both routes target the metal-nitrogen bonds that hold the cSDAs in place, which are relatively weak compared to the metal-oxygen bonds holding the MOF’s core skeleton structure together.
Chromium- and iron-based MOFs were chemically stable enough for the team to selectively remove the cSDA scaffolding using an acid wash. For MOFs with more modest stability, such as those based on indium, the team developed a milder method based on treating the material with a reagent called imidazole.
Removing the cSDA scaffolding transformed the materials’ properties and performance. “The porosity of the material was increased by up to 50% in the best cases, to the highest pore volumes ever reported for iron-, indium- and chromium-based MOFs,” explains Marina Barsukova, a postdoc in Eddaoudi’s lab. The team tested a MOF called Fe-sod-ZMOF-300 for its methane storage capacity, and showed it could reversibly store approximately 20 percent more of the gas once the cSDA was removed.
“Once the framework becomes structurally encoded and self-supported, removal of the cSDA unlocks the true functionality of the material, such as accessible pore space, enhanced adsorption properties, and new opportunities for selective transport,” Eddaoudi says.
To date, MOFs have been mostly static structures. The next step, Eddaoudi explains, is to develop MOFs that can dynamically change their structure and function in a controlled manner over time. “We envision porous materials in which transient structure directing agents not only enable unprecedented topologies and pore architectures, but orchestrate emergent functionalities including selective separations, catalysis and conductivity,” he concludes.
Saltgrass (Distichlis spp.) is a plant that can thrive naturally in highly saline environments. Some species produce edible grain-like seeds, making them promising candidates for future crop development.
Until now, little has been known about the genetics behind saltgrass’s high salt tolerance. New research establishes comprehensive genomic resources for two saltgrass species. The work provides a basis for neodomestication — the rapid developing of wild plants into crops using modern genomics and breeding — and improves our understanding of genome evolution in salt-tolerant grasses[1].
Senior author of the work, Jesse Poland, heads a research group at KAUST with a focus on developing climate-resilient crops. “We are really interested in halophytes – plants that can grow in very saline environments and have strong potential for agriculture,” he says. “In the face of expanding areas of salt-affected agricultural land, being able to domesticate a crop like saltgrass would be a game changer.”
Eleven saltgrass species are distributed across North and South America, with another species in Australia. They occupy saline habitats not accessible to most plant species and are already recognized as valuable plants for conservation and restoration of degraded land.
The comprehensive study of population structure in saltgrass involved whole genome sequencing of 364 individual plants from 35 geographically distinct populations across North America.
Lead author Kashif Nawaz, a researcher at KAUST, says the results revealed several interesting and unique features of the saltgrass genome, including the presence of B chromosomes (also known as supernumerary or accessory chromosomes). The researchers also found striking genetic differences between the two saltgrass species D. spicata and D. stricta, which resulted from a chromosome fusion.
“These two species look basically identical so it was surprising to find that they are very different genetically,” says Nawaz.
As they built a clearer picture of the genome, Nawaz realized it could provide an ideal platform for research into salinity and other stress-response mechanisms. “The genome is very small compared to other crop plants like wheat, but with all the essential genes, it could be a useful research tool,” he says.
The species is dioecious (has separate male and female plants), and the researchers have now mapped the sex-determining region on the chromosome to produce genetic markers for determining plant sex.
While B chromosomes and dioecious plants are known in other plant species, Poland says it was very interesting to find both features in one plant.
“This work provides the foundational knowledge we need to start breeding improved varieties. It’s also highlighted many interesting features – what makes saltgrass what it is, and what lies behind its mechanisms for extreme salt tolerance,” he says.
“Our research reveals how saltgrass functions on a molecular level to survive in extreme environments. We can use this information to breed crops that can be cultivated with saline groundwater or even seawater,” says Poland.
The study benefited from access to diverse germplasm provided by U.S. collaborators, who collected samples from wild populations, as well as a USDA collection of saltgrass accessions from different populations.
The neodomestication process can now be used by plant breeders, including Poland’s group, to take the next step to develop saltgrass species with favourable crop characteristics.
For Saudi Arabia and other arid regions, this research is especially relevant because it supports the long-term vision of developing crops and farming systems that can use saline water resources.
Antibodies, enzymes, and other protein-based drugs are among the most powerful tools in medicine, and clinicians often combine them for greater effect. However, each one travels through the body independently and cannot penetrate cells, meaning they can only influence cellular activity from the outside.
Using specially engineered nanoparticles, KAUST researchers have packaged an entire six-protein biochemical pathway into a single delivery unit and shuttled it into living mammalian cells, where the proteins arrived together and functioned as a self-contained molecular assembly line[1].
The findings establish what the team calls ‘pathway transplantation’: a technique that could eventually allow drug companies to introduce working multi-protein systems directly into target cells, bypassing the hit-or-miss coordination on which combination protein therapies currently depend and potentially allowing diseased cells to produce therapeutic molecules locally.
Notably, the approach does not involve genetic engineering. No DNA is altered; no genes are inserted. The proteins themselves are the therapy, delivered ready-made and ready to work, without the challenges associated with modifying a patient’s genetic material.
“This is the most complex multi-protein system encapsulated in a MOF to date,” says Ainur Sharip, a former Ph.D. student in Stefan Arold’s laboratory. “And it’s the first time such a multi-enzyme nanoreactor system has been delivered into cells to produce a complex drug molecule,” adds Somayah Qutub, a former Ph.D. student in Niveen Khashab’s materials science laboratory and now a postdoctoral researcher at KAUST.
Sharip and Qutub shared first authorship of the new study, published in Advanced Materials.
The work brings together two distinct threads of research developed in parallel at KAUST. Arold’s laboratory has long studied how proteins interact and cooperate within complex biological systems. Khashab’s group, meanwhile, has pioneered the engineering of metal-organic frameworks (MOFs) — sponge-like crystalline materials whose internal pore sizes can be precisely controlled — as vehicles for delivering biological cargo into cells.
For this study, the teams enlarged the pores of an iron-containing MOF by treating it with acetic acid, making enough space to absorb a six-protein mixture in a single step. Protein loading was highly efficient: more than 97 percent of the proteins were captured and retained.
To put the platform to the test, the researchers chose to deliver a six-protein pathway borrowed from a purple-pigmented soil bacterium, which converts a common amino acid into a compound called violacein, a natural pigment with a deep purple hue that is easily visible to the naked eye.
When the loaded nanoparticles were added to human cells in the laboratory, the cells turned purple, confirming that all six proteins had arrived together, remained active, and functioned cooperatively within the cells. “These nanoreactors enter cells where they start integrating into — and changing — the cell’s biochemistry,” explains biochemist Raik Grünberg, a research scientist in Arold’s laboratory, who led the study.
Violacein is a promising compound being investigated for several therapeutic applications, and the researchers hope to further develop their delivery system toward cancer treatment. The key advance of this study, however, is the platform itself: a general-purpose tool that could potentially deliver a wide range of cooperative protein systems into different cell types.
Pathways that regulate the immune system, correct metabolic errors, or trigger precisely targeted cell death could, in principle, all be packaged and delivered the same way, Grünberg says. The nanoreactors also survive freeze-drying, remain active after weeks in storage, and can be reused multiple times, which are important attributes if the technology is ever to reach patients.
What’s more, the iron-based MOF at the heart of the platform has already been shown to be biodegradable and well tolerated in mice, an encouraging sign that therapeutic applications will be possible.
“Our next step will be to try the system in animal models,” Grünberg says, “because we think this could become a new therapeutic approach for a wide range of diseases.”
Healthy soils are teeming with life, including bacteria, fungi, viruses and other microbes, collectively known as the soil microbiome. Now, global research suggests that when this biodiversity is reduced, soil-dwelling human pathogens may be more likely to gain a foothold. As climate change makes many regions warmer and wetter, those risks are likely to grow, particularly in intensively managed agricultural landscapes. This insight comes from a comprehensive global assessment of soil-dwelling pathogens that provides important information to help guide pathogen surveillance, risk prediction and land management strategies aimed at reducing disease outbreaks.
KAUST’s Fernando Maestre was part of the study, led by the University of Western Australia, which analyzed 1,602 soil samples from 59 countries. The team identified 80 bacterial taxa classified as potential soil-inhabiting human pathogens[1]. Among these, 25 taxa were identified as dominant because they were widespread, present in at least 80 percent of samples, and highly abundant within the pathogen community.
Using the data, the team produced global maps of how the bacteria are currently distributed and how they are likely to be distributed under predicted climate change scenarios.
Soil biodiversity and global warming
The broad trends are concerning. The results showed a positive correlation between temperature and relative abundance of dominant human pathogens, indicating a possible increase of these soil-dwelling bacteria under global warming scenarios. Pathogens were found to be more common in wet ecosystems in tropical and temperate regions and particularly abundant in cropping soils.
The analyses also showed links between pathogen prevalence and global patterns of mortality from infectious diseases. For example, the predicted global map of Mycobacterium tuberculosis complex showed a pattern comparable with the global tuberculosis map estimated by the World Health Organization (WHO).
“Our models suggest that many dominant soil-inhabiting bacterial pathogens are likely to increase in relative abundance under future climate scenarios, particularly in regions that become warmer and wetter,” says Maestre, who coordinated samples from a global dryland survey, an important component of the global soil dataset analysed in the project.
A significant finding was not just where the pathogens were most prevalent, but also where they were scarce. Areas with more diverse soil microbiomes were associated with lower pathogen abundance. This pattern suggests that increasing soil microbial diversity can potentially reduce the proliferation of plant and human pathogens, such as E. coli.
These patterns of pathogen distribution have profound implications for disease prevention that extend well beyond the public health sector.
“An important message from the study is that protecting soil biodiversity, improving soil health and monitoring environmental reservoirs of pathogens should become part of strategies to reduce future disease risks, especially under climate change,” Maestre says.
“Our maps can help countries identify where environmental monitoring should be prioritised, for example in humid, tropical and temperate regions, wetlands, farmlands, and areas expected to become warmer or wetter with climate change.”
The results provide global baseline data for developing effective surveillance and predictive tools to improve risk assessment and management strategies associated with human bacterial pathogens and to support the WHO One Health approach, where soils, water, crops, animals and humans need to be considered together.
Monitoring soils, especially in areas prone to flooding, heavy rainfall, intensive agriculture or biodiversity loss, could provide an early-warning system that complements clinical surveillance. This could help identify environmental hotspots where the risk of exposure to some pathogens may be higher.
However, Maestre cautions that the maps do not forecast future disease outbreaks directly.
“Whether environmental pathogens lead to infections depends on many other factors, including exposure routes, sanitation, land use, healthcare systems, socioeconomic conditions, host susceptibility and public health policies,” he notes.
He believes there is an urgent need to identify the major environmental drivers and global distribution of soil-inhabiting human pathogens to develop effective tracking, predict future distributions and improve risk management strategies linked to infectious diseases.
Monitoring and surveillance
While environmental monitoring is already being used in some forms, most notably wastewater surveillance, monitoring of soil-dwelling human pathogens is far less developed. “Technically, implementing this type of monitoring is becoming increasingly feasible because the sequencing and bioinformatic tools needed to detect pathogens from environmental samples are now available,” says Maestre.
In fact, the study team used these tools, including shotgun metagenomics, quantitative PCR, whole-genome-based analyses and machine learning, which he says can be adapted for monitoring programs, particularly for priority pathogens and high-risk locations.
Key challenges to implementing such systems are also organisational and financial. Countries would need to establish or access standardised sampling protocols, long-term monitoring sites, laboratory capacity, reference databases, and strong links between environmental agencies, agricultural authorities and public health systems.
Although this study focused specifically on bacterial pathogens, soils also harbour fungi, viruses, and other organisms that can affect human, animal and plant health. While they need to be studied separately, Maestre says the broad message is clear: Soil biodiversity is not just an environmental asset; it is public‑health infrastructure. Protecting and restoring it should be viewed as part of a One Health approach that recognises the interconnectedness of soils, water, crops, animals and people.
“We need to better understand the environmental reservoirs of pathogens, not only the clinical cases they cause. Future work should expand this approach to fungal and viral pathogens and, ideally, integrate them into a broader environmental surveillance framework.”
Microplastic, in the form of polyethylene terephthalate (PET), is a significant pollutant in marine environments. “Mangrove ecosystems are particularly vulnerable to the accumulation of fossil-derived plastics,” says KAUST researcher Diego Javier Jiménez Avella. “These ecosystems are natural sinks, but they are also potentially promising reservoirs of novel lignocellulose- and plastic-transforming enzymes.”
Jiménez, a research scientist in Alexandre Rosado’s team, led an international project that showed adding lignocellulose in the form of rice husks to mangrove soils increased the likelihood of recovering potential PET-degrading enzymes such as PETases[1].
The project began in 2021, when Jiménez initiated a study of the microbial transformation of plastics with his former research group at Universidad de los Andes (UniAndes) in Bogotá, Colombia. The team sought to understand how microbial communities derived from mangrove soils respond to inputs of microplastics, plant biomass and seawater.
Initially, the researchers tried to identify plastic-degrading microorganisms by adding PET particles. Because of the difficulty in degrading PET, they tried an alternative treatment, adding plant biomass rich in lignocellulose, which contains polymers with ester linkages, similar to those found in PET molecules.
Seawater was included as a strategy to increase the chances of finding PET-degrading capabilities by mixing marine- and terrestrial-derived microbial communities. Unexpectedly, this addition proved vital for the desiccation patterns and salinity gradients within the microcosm experiments.
“Without planning it, the incubation conditions created a gradient of desiccation and salinity — an unforeseen factor that ultimately proved crucial to our findings,” says Jiménez.
The project continued when Jiménez moved to KAUST to join Rosado’s team in 2023. María Fernanda Peña-Valencia, his master’s student at UniAndes, worked on genome analyses, which provided key insights into the functional potential of salt-tolerant microorganisms enriched during the microcosm experiments.
“These results helped us better understand how specific microbial groups adapt and thrive under the experimental conditions,” says Jiménez. “A real turning point came when we expanded our analysis to gene catalogs derived from the full metagenomic dataset.”
Using high-throughput metagenomic sequencing to identify the different microbial species, the team found that conditions of desiccation and increasing salinity favor salt-tolerant PETases. The gradual evaporation of seawater and associated increase in salinity acted as strong selective pressures, particularly in the lignocellulose treatment.
Surprisingly, they discovered a higher number of potential PETases in the lignocellulose treatments compared to those amended with PET particles themselves. The researchers identified putative salt-tolerant PETases belonging to a new family of enzymes and characterized them using AI-based tools and 3D structure comparisons.
The study identified potential PETases found in soil bacteria. These enzymes can remain active under extreme conditions such as high temperatures and low pH, which makes them particularly interesting for industrial applications, explains Rosado.
PET is the only plastic that has been enzymatically recycled at an industrial scale. Over the past few decades, research efforts have focused on screening and engineering PETases, aiming to identify variants that can operate efficiently in both environmental and industrial settings.
“We still need to identify efficient thermophilic and salt-tolerant PETases for the industrial biocatalysis of PET,” Rosado says.
“Our work suggests that disrupting microbiomes with polyester-rich substrates can be an effective pathway for the discovery of PETases that can be used as scaffolds for protein engineering and biotechnological applications,” he concludes.
In future, the researchers plan to produce the enzymes and test them directly on PET under industrial conditions. They aim to develop a cocktail of enzymes able to degrade PET under harsh conditions of high temperature and salinity.
Plants cannot uproot and move to shelter as temperatures rise, meaning they must rely on internal mechanisms to survive heat stress. A specific chlorophyll-related enzyme has been shown to play a key role in increasing tolerance and protecting photosynthetic machinery in Arabidopsis thaliana plants exposed to high temperatures[1].
“When cells encounter stress, tiny condensates composed of proteins, RNA and metabolites quickly form. These ‘stress granules’ help protect key cellular components and mechanisms until the danger from stress has passed,” says Fatema Alquraish, who worked on the project under the supervision of Monika Chodasiewicz. Around five years ago, Chodasiewicz and colleagues from an international research team were the first to identify stress granules in chloroplasts (cpSGs) in Arabidopsis plants[2].
“It would take a huge amount of energy for a plant to protect all of its machinery and cellular components under heat stress,” continues Alquraish. “Forming stress granules rapidly in an emergency is a smart and selective way for the plant to shelter key components needed for the recovery phase after stress eases. The granules provide protection, and also allow the various components to ‘talk’ to one another and instigate repair and recovery processes.”
“This study was inspired by a simple question: do chloroplast stress granules merely appear during heat stress, or do they actively help plants tolerate heat? This led us to investigate specific proteins inside these granules and examine their roles,” says Chodasiewicz.
The team’s initial investigations into components of cpSGs led them to protochlorophyllide oxidoreductase C (PORC), a chlorophyll biosynthesis enzyme that is involved in chlorophyll production and photosynthesis, and is usually distributed evenly in the chloroplasts. The team noticed that, in response to elevated temperatures, PORC quickly localized into small, dot-like cpSGs as they formed.
In further experiments, the team showed that plants with higher PORC levels recovered photosynthesis faster and performed better under heat stress. Plants lacking PORC function were more sensitive to heat stress, suggesting that PORC helps preserve chloroplast function and protect the plant’s photosynthetic machinery during stressful conditions.
“We observed PORC granule formation under acute heat shock conditions as well as under milder, prolonged heat stress,” says Alquraish. “Under sudden extreme heat, cpSGs containing PORC formed within 30 minutes. Under sustained moderate heat, the granules developed more gradually. This suggests that the mechanism is flexible and can respond to the different types of thermal stress that plants may encounter in nature.”
The findings imply that cpSGs may represent an untapped strategy for improving plant resilience to heat stress, which is especially crucial for food security in arid countries such as Saudi Arabia.
“In future, it may be possible to tune cpSG formation, stability, or composition in crops, so they maintain photosynthesis more effectively during heat waves,” says Chodasiewicz. “We are interested in whether cpSG behavior can be genetically or chemically tuned to improve heat tolerance without compromising growth. We may also be able to enhance how plants reorganize chloroplast machinery in response to stress.”
Next steps for Chodasiewicz and her team include understanding the molecular rules that control cpSG assembly and disassembly, identifying additional protective components inside cpSGs, and testing whether similar mechanisms exist in different crop species.
International plans to increase marine protected areas (MPAs) to cover 30 percent of the world’s oceans by 2030 will not be sufficient to conserve many of the world’s largest marine creatures, according to new findings[1] by hundreds of international scientists including KAUST researchers as part of the MegaMove[2] project.
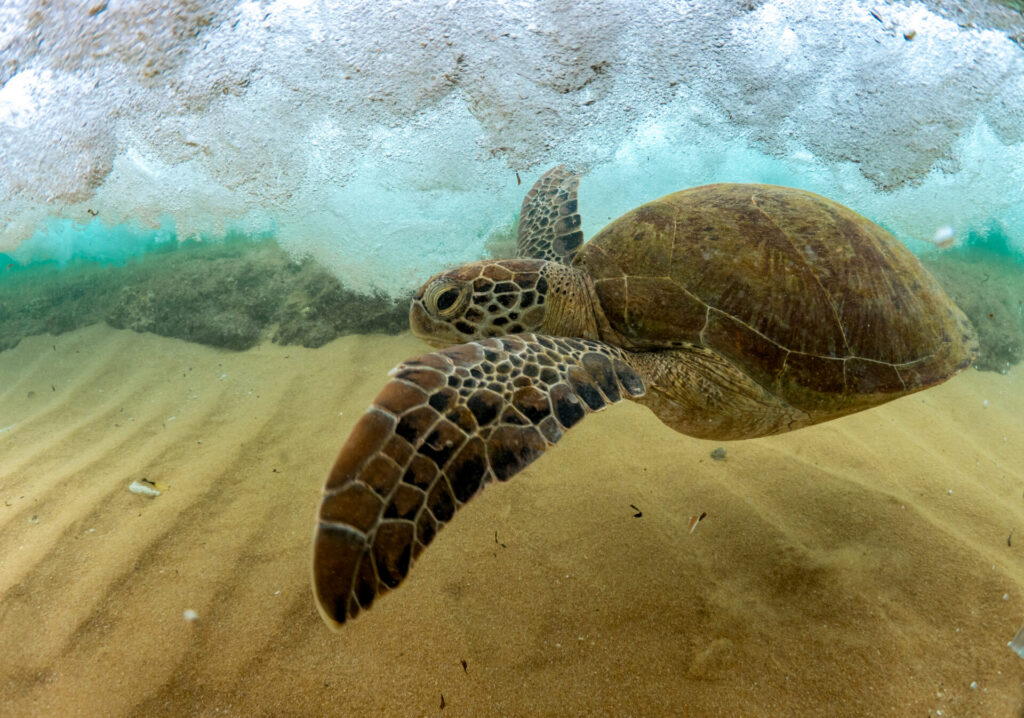
Habitats and ecosystems in the world’s oceans face growing threats, from anthropogenic activities, such as fishing and industry, to the deeper pressures posed by climate change. Tied to the fate of the oceans are the fates of marine life, from the smallest creatures to the largest – marine megafauna. Over a third of marine megafauna species, including the hawksbill turtle, the North Atlantic right whale, and the shortfin mako shark, are now threatened with extinction.
Recent global commitments via the United Nations High Seas Treaty and the Kunming-Montreal Global Biodiversity Framework (GBF) seek to protect, conserve and manage at least 30 percent of the world’s oceans. But this is unlikely to be enough.
“Protecting the ocean requires a clear understanding of how marine life actually uses ocean spaces,” says Carlos Duarte, marine scientist at KAUST. “Imagine if pedestrian crossings were just randomly deployed in cities, rather than being concentrated in the busiest areas where they’re needed most? Understanding how marine megafauna use the oceans for migration, residency, feeding and breeding is critical to developing effective protection and conservation strategies.”
Duarte and hundreds of scientists across the world collaborated to collate and analyze a vast marine megafauna tracking dataset: 11 million geographical positions gathered over three decades from 15,845 tracked individual animals across 121 species of marine megafauna. Their results show that both existing and proposed MPAs will need to be coupled with enforced mitigation strategies, including strict fishing regulations and separation of wildlife and boat traffic, if they are to achieve international goals for marine megafauna conservation.
A monumental moment in movement ecology
“Marine animals are highly mobile, often engaging in large, basin-wide migrations,” says Duarte. “From the largest creatures, such as whales and albatross, to smaller fish like the endangered European eel, they all make epic journeys to breed and feed. Accurately tracking these movements is no small feat.”
Advances in Big Data analytics, which combines data from multiple animal tagging and tracking programs, have made large-scale tracking of marine animals possible. The MegaMove project was founded in 2020 based on Duarte’s vision that collaborative science and Big Data could accelerate understanding of how large marine animals use the oceans. It combines expertise and vast datasets to provide robust evidence for international marine policies and treaties.
KAUST hosted one of the foundational workshops that helped launch MegaMove. But challenges remained, not least persuading scientists to share their hard-earned datasets.
“Animal tagging is very expensive: buying sensor packages, paying for vessels and staff to catch the target animal in the wild, and then paying for satellite data transmission,” says Duarte. “It is perhaps no wonder that researchers have been reluctant to share their data.”
Over the past six years, MegaMove has helped change attitudes toward data sharing in the biologging community, Duarte notes. After demonstrating how large-scale data analytics can reveal patterns in marine animal behavior, researchers are now voluntarily contributing telemetry datasets to the project.
Unlocking the power of telemetry data
For the current study, the team developed their own data analytics tools to unify all the data acquired across species and years into a single ‘biology year’ of movement in the ‘global ocean’. They then classified each individual geo-position based on the activity of each creature, labeling each position as ‘migrating’, ‘feeding’ or ‘reproducing’.
“By aggregating data from individuals and species, we created a synoptic map of the world’s ‘hot spots’ for feeding and reproduction, and highlighted the migration corridors of marine megafauna,” says Duarte. “This revealed previously unknown features of their use of ocean space.”
The team then aligned these data insights, including their synoptic map, with existing MPAs and exclusive economic zones (EEZs). Existing MPAs encompass only 7.5 percent of the total area used by creatures in the tracking dataset, and the animals spent over 85 percent of their time outside these protected areas. The locations of future MPAs therefore need careful consideration, and the team have estimated the best possible configuration of future protected areas to offer optimal protection to marine megafauna.
“Our results should help identify critical ocean areas for protection. Also, individual nations have strong enforcement capabilities within their own EEZ jurisdictions, so they can choose to actively regulate human activities that harm marine animals, and designate specific areas for conservation and protection,” says Duarte. “Considerable challenges remain in securing and enforcing marine protected zones for international waters.”
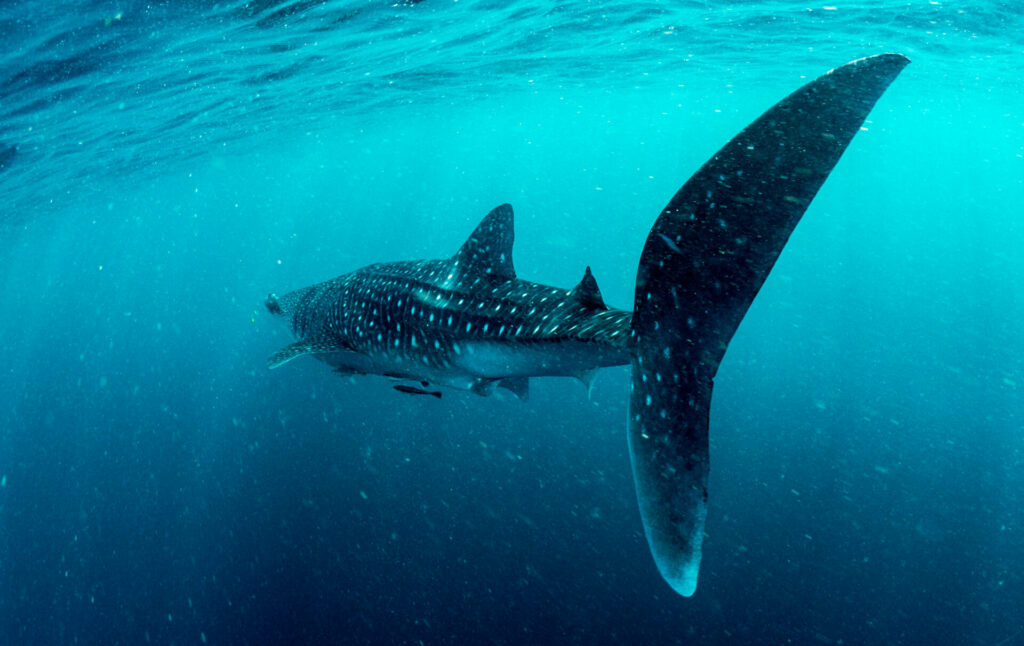
The researchers also examined global datasets regarding threats to marine wildlife, including fishing intensity, shipping intensity, plastic density, and water temperatures. Every year, an estimated 3,000 great whales are killed by ship strikes, and the MegaMove project has also identified ship strikes as the top source of mortality for whale sharks, the largest fish in the ocean. The team also found noise pollution from human activities to be ubiquitous across the oceans.
Their results suggest that additional forms of ocean management will be needed to curb existing threats and achieve the GBF’s goals. The team is calling for greater scrutiny of fishing and industry practices, increased enforcement, and improved direct management of marine ecosystems. Their findings should help redirect marine traffic to safer corridors and substantially reduce the risks of ship strikes on marine animals.
What’s next
The MegaMove project aims to strengthen the evidence base for marine megafauna conservation and expand participation from researchers around the world.
“Further insights are possible from long-term datasets describing movements of multiple individuals of the same species, but such datasets are not yet available. Long-term tracking data could reveal how animal movements change in response to pressures such as fishing and ocean warming, which we currently understand only anecdotally. Longitudinal studies will also allow us to verify and demonstrate the benefits of well-managed ocean protection zones,” concludes Duarte.